Putting Reef to the Test: Throughput and Recovery in RGW Workloads
Introduction 
We invite you to read the first installment of a blog series called “Putting Reef to the Test” - a series in which we explain how we tested upstream Reef in a diverse set of scenarios to measure its functionality and performance against Quincy baselines.
All results in this article are courtesy of the Storage Workload DFG team. Read on to see how we put Reef to the test by filling RGW clusters, aging them, inducing node failure, and kickstarting recovery to gather the latest throughput and recovery results.
Test Plan 
The following set of tests were designed to verify RADOS and RGW functionality as well as to measure baseline performance at scale. All tests were performed on an upstream version of Reef (18.1.2) and repeated on an upstream version of Quincy (17.2.6) for comparison purposes. Two sets of object sizes were employed: The smaller object sized workload uses five Warp drivers with a range of fixed sizes (1KB, 4KB, 8KB, 64KB, 256KB), one size per bucket, as opposed to more generic sized objects (1MB, 4MB, 8MB, 64MB, 256MB).
Test Cycle 1: RGWtest Workload 
This test cycle fills an RGW cluster and measures performance when the cluster is new, and after the cluster has aged for a few hours. This test cycle was performed on small and generic sized objects. The following points describe each step of the test cycle:
- Cluster fill - @4hrs
- 1hr hybrid workload measurement of new cluster (45% reads, 35% writes, 15% stats, 5% deletes)
- hybrid aging workload
- same operation ratio
- 24hrs for smaller sized objects, 12hrs for generic
- 1hr hybrid workload measurement of aged cluster
Test Cycle 2: OSDfailure Workload 
This test cycle fills an RGW cluster and measures performance and recovery time in various node-failure scenarios. This test cycle was performed on small and generic sized objects. The following points describe each step of the test cycle:
- Cluster fill - @4hrs
- 2hr hybrid workload - no failure
- 2hr hybrid workload - One OSD node (24 OSDs) stopped
- 2hr hybrid workload - Another OSD node (24 OSDs) stopped
- 2hr hybrid workload - Missing OSDs started
- Monitor recovery until all PGs are active+clean
Test Environment 
The following points show the hardware, software, and tools that were used in our testing scenarios. Tests were run on two clusters, each with 8 OSDs and 4096 PGs. We ran each test scenario on the latest upstream Quincy version (17.2.6) to gather baselines, and then on Reef upstream (18.2.1) to gather comparison results. Results were generated and gathered with the minio warp tool.
Hardware 
- 3x MON / MGR nodes
- Dell R630
- 2x E5-2683 v3 (28 total cores, 56 threads)
- 128 GB RAM
- 8x OSD / RGW nodes
- Supermicro 6048R
- 2x Intel E5-2660 v4 (28 total cores, 56 threads)
- 256 GB RAM
- 192x OSDs (bluestore): 24 2TB HDD and 2x 800G NVMe for WAL/DB per node
- Pool: site{1,2}.rgw.buckets.data = EC 4+2, pgcnt=4096
- Five warp driver nodes each running multiple clients
Software 
- RHEL 9.2 (5.14.0-284.11.1.el9_2.x86_64)
- Quincy upstream (17.2.6) for comparison with Reef upstream (18.1.2)
- Non-default settings
- log_to_file true
- mon_cluster_log_to_file true
- rgw_thread_pool_size 2048
- rgw_max_concurrent_requests 2048
- osd_memory_target 7877291758
- osd_memory_target_autotune false
- ceph balancer off
- PG autoscaler pg_num_min
- 4096 data
- 256 index
- 128 log/control/meta
Tools Used 
- Warp v0.6.9-without-analyze
- RGWtest
- OSDfailure
Results 
During cluster fill and aging scenarios, we saw significant throughput improvement in Reef, especially for small object workloads. During OSD failure scenarios, we saw Reef’s throughput decrease for both object sizes; however, this decrease was largely won out by faster recovery times, especially for small object workloads.
RGWtest - Small Object Sizing 
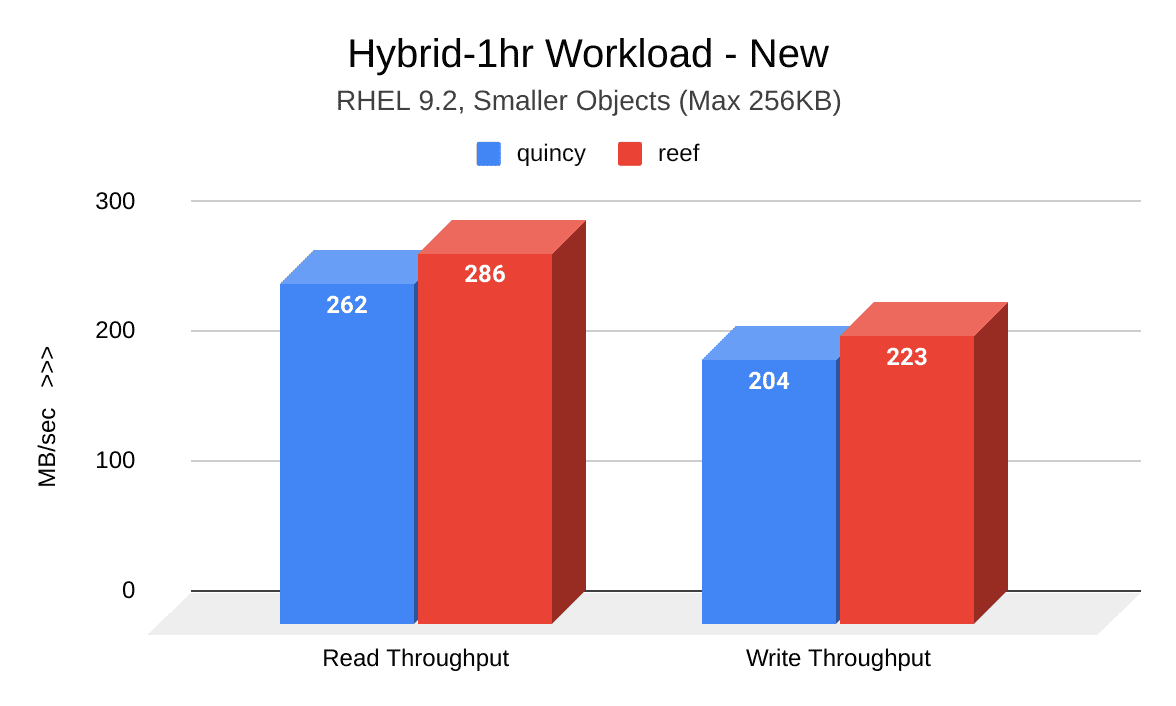
The cluster fill and aging workloads performed in this test cycle revealed significantly improved throughput results in Reef.
The following image shows a comparison of read and write throughput (MB/sec) between Quincy (blue) and Reef (red) when the cluster was new. Reef shows significant improvement:
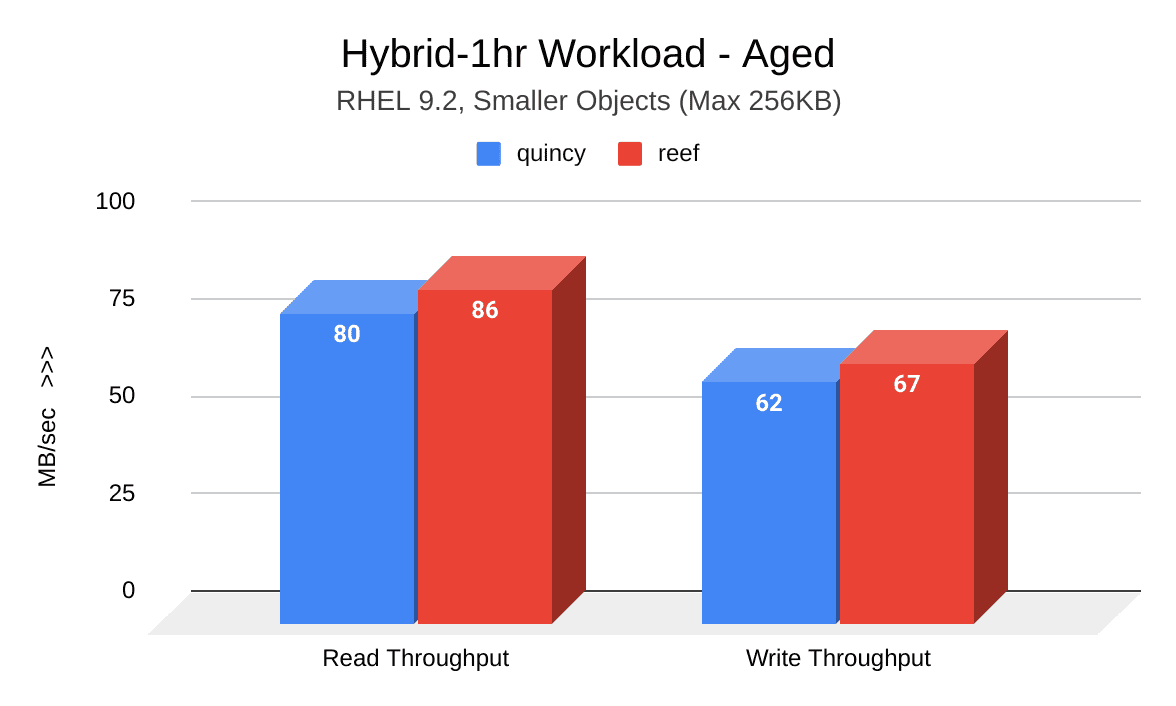
The following image shows a comparison of read and write throughput (MB/sec) between Quincy (blue) and Reef (red) after the cluster was aged. Reef shows significant improvement:
OSDfailure - Small Object Sizing 
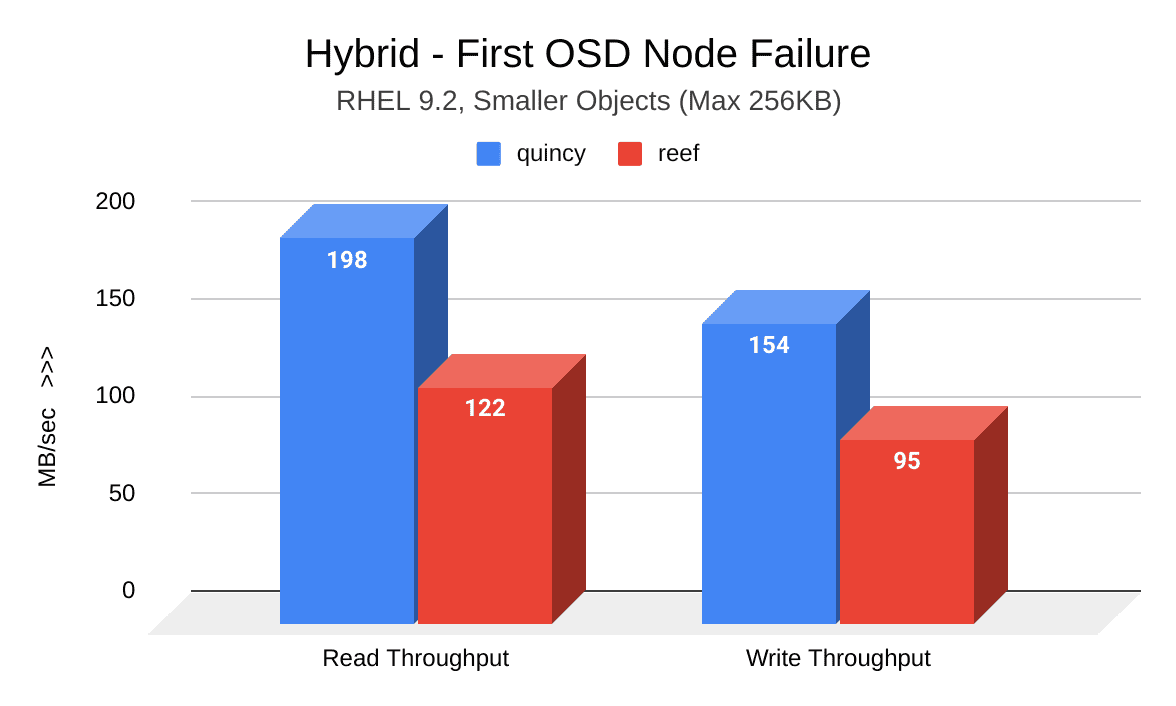
Although induced OSD node failure workloads revealed a decrease in Reef’s throughput, the loss came as a result of significant recovery time improvements.
The following image shows a comparison of read and write throughput (MB/sec) between Quincy (blue) and Reef (red) after the first induced OSD node failure. Reef shows a decrease in throughput:
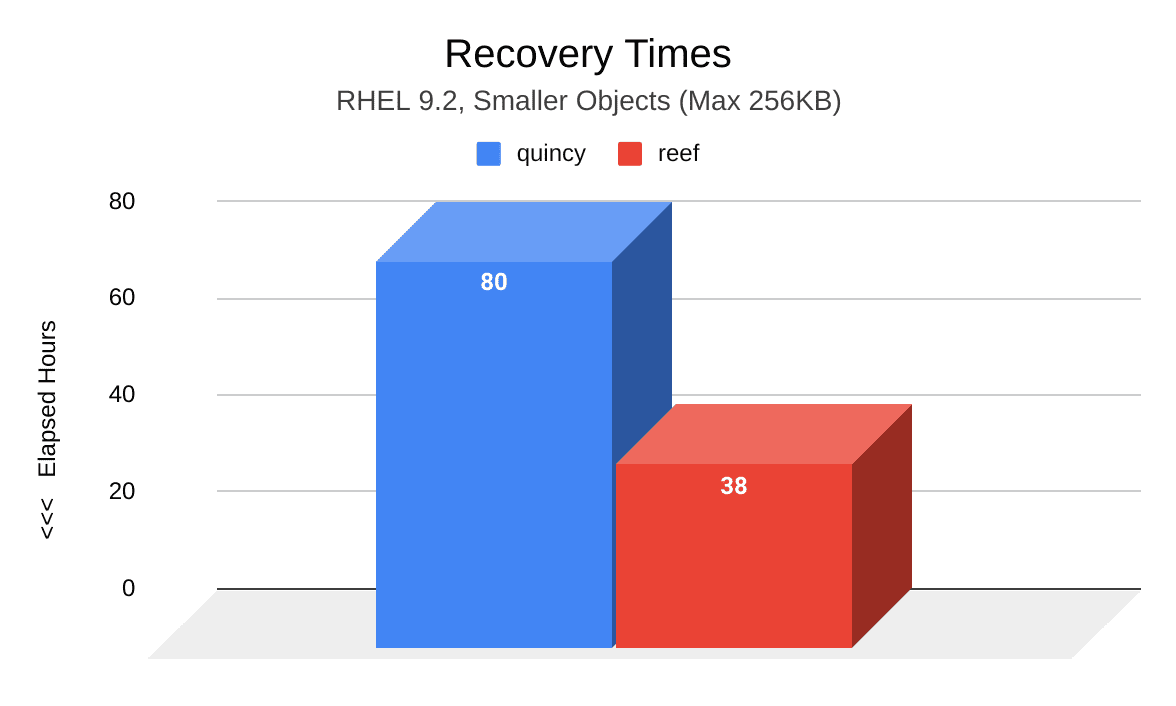
The following image shows a comparison of recovery time (hours) between Quincy (blue) and Reef (red) after two induced OSD node failures. Compared to Quincy, PGs in Reef took significantly less time to reach an active+clean state. At a total of 38 hours, Reef’s recovery time took 42 less hours than Quincy’s recovery time of 80 hours.
RGWtest Test Cycle - Generic Object Sizing 
The cluster fill and aging workloads performed in this test cycle also showed that Reef's throughput was as good, or slightly better, than Quincy's.
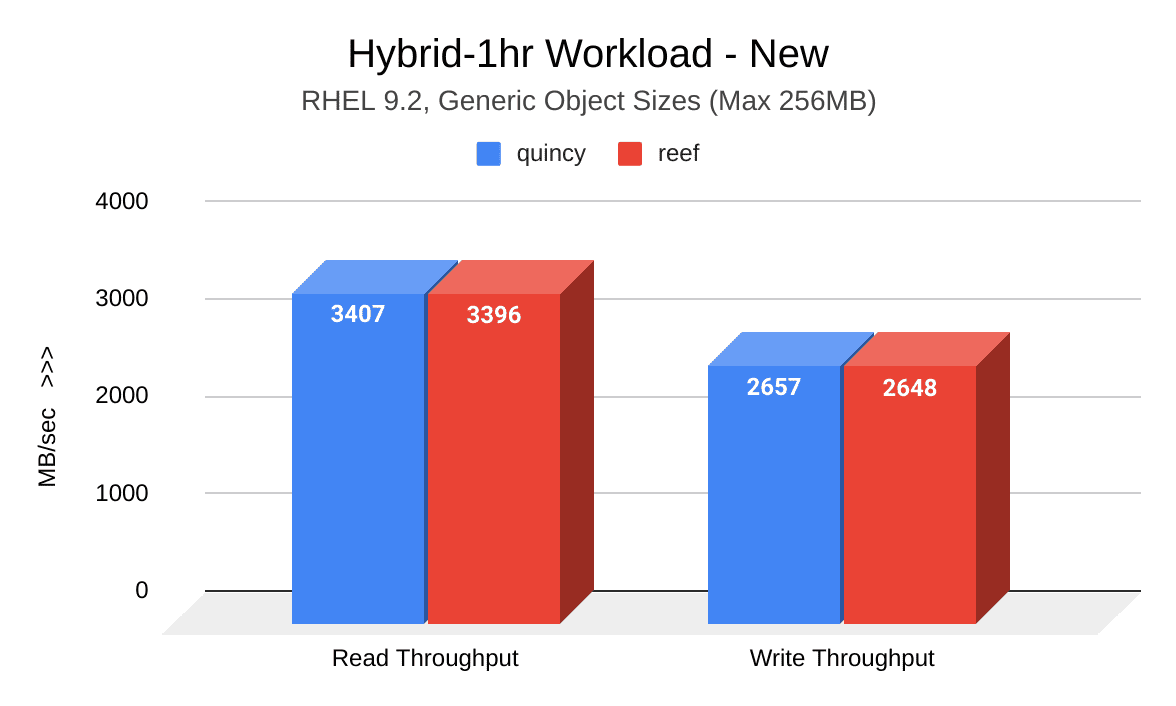
The following image shows a comparison of read and write throughput (MB/sec) between Quincy (blue) and Reef (red) when the cluster was new. Reef's results are comparable to Quincy's:
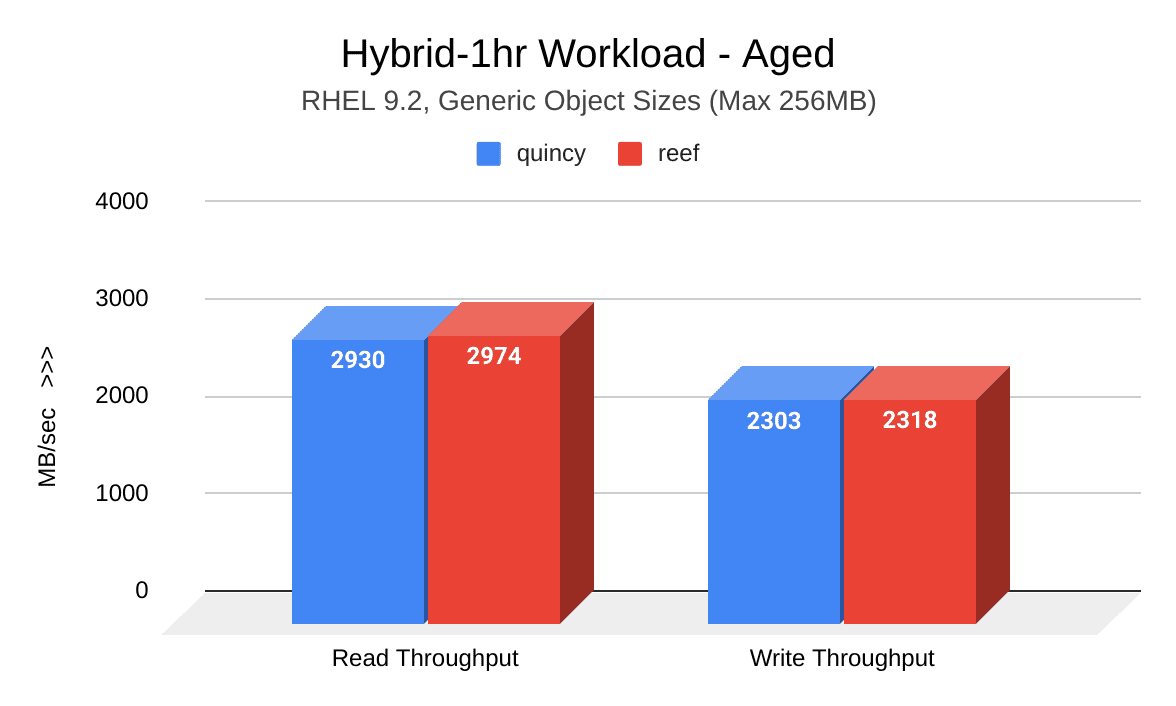
The following image shows a comparison of read and write throughput (MB/sec) between Quincy (blue) and Reef (red) after the cluster was aged. Reef shows a slight improvement:
OSDfailure Test Cycle - Generic Object Sizing 
As with small objects, generic object OSD node failure workloads revealed a decrease in Reef’s throughput. This loss, however, was also accompanied by an improvement in recovery time.
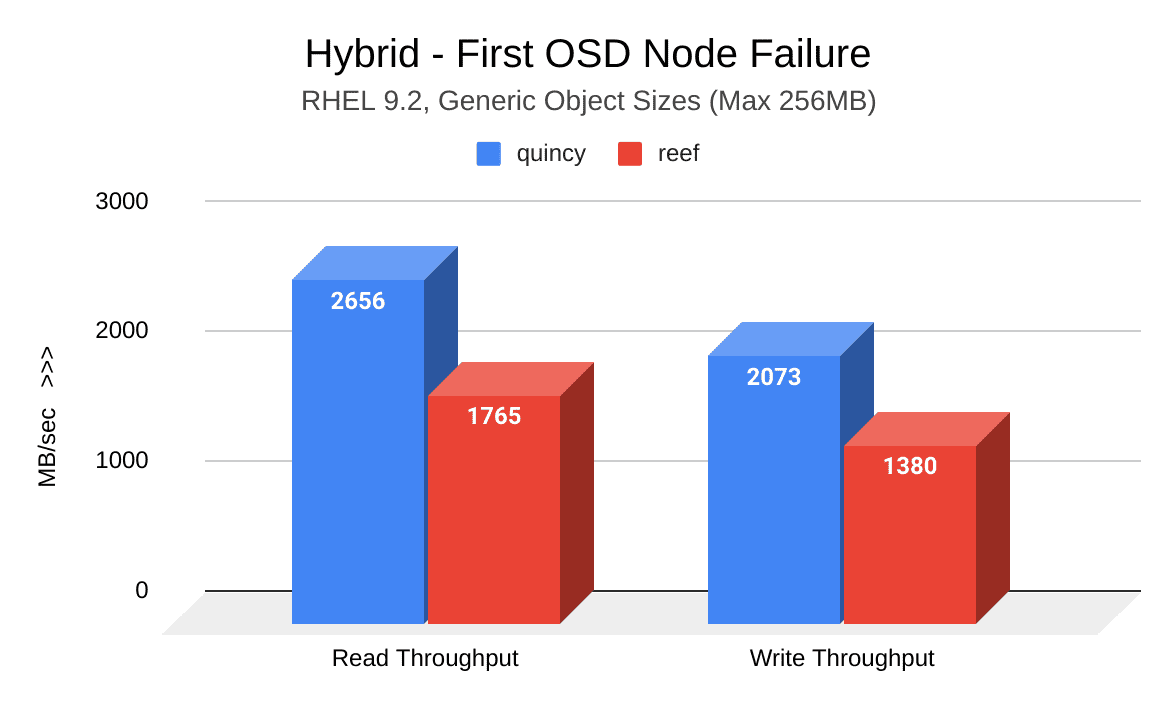
The following image shows a comparison of read and write throughput (MB/sec) between Quincy (blue) and Reef (red) after the first induced OSD node failure. Reef shows a decrease in throughput:
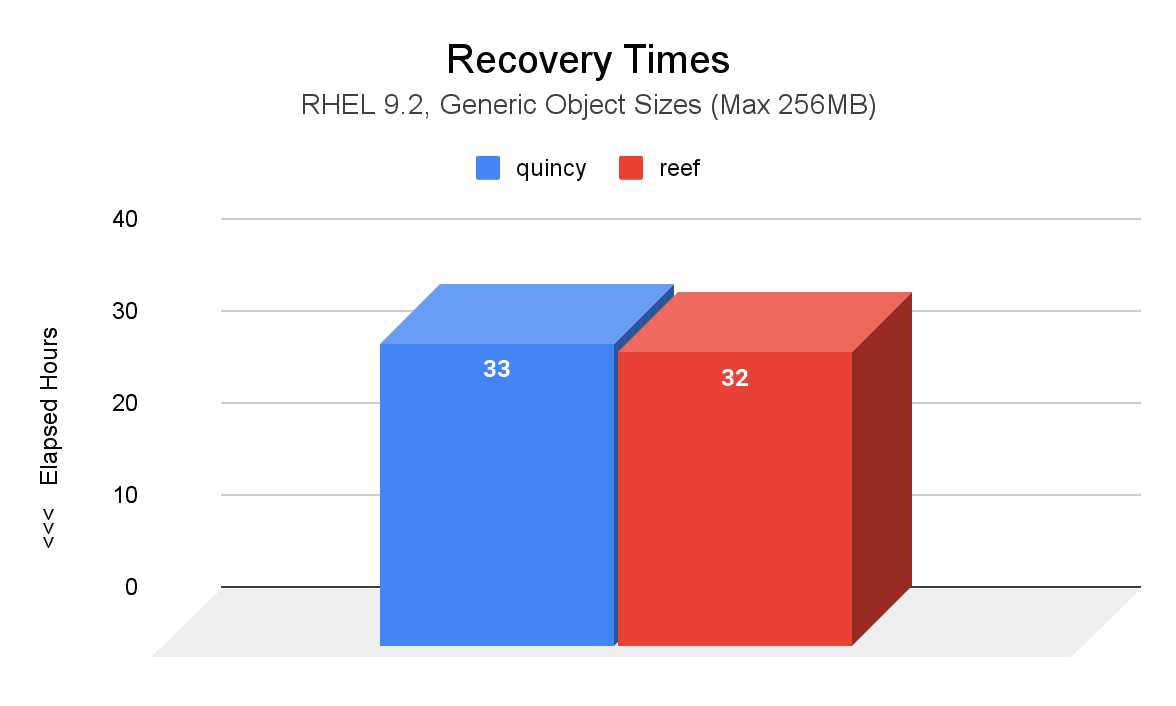
The following image shows a comparison of recovery time (hours) between Quincy (blue) and Reef (red) after two induced OSD node failures. Compared to Quincy, PGs in Reef took 1 hour less to reach an active+clean state.
Resource Consumption 
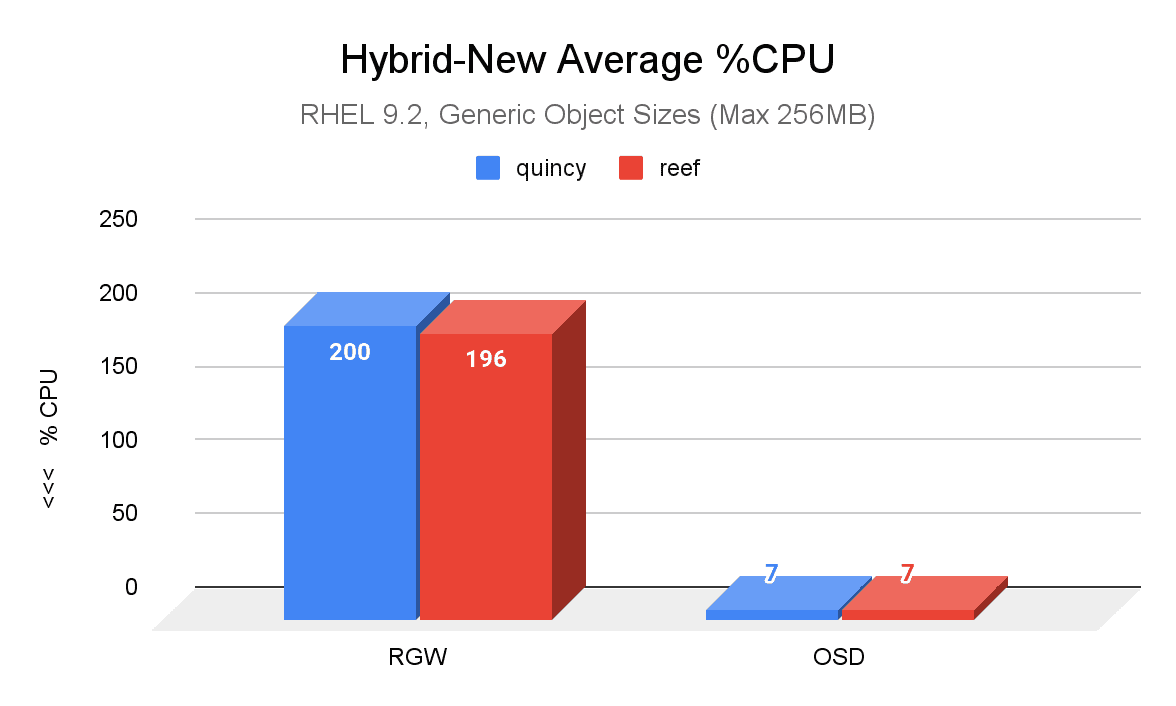
CPU utlilization was also measured during cluster fill and aging workloads, as well as during the OSD failure scenarios. These results proved to be comparable across releases for both small and generic object sizes.
The most notable difference is shown in the following image, which is a comparison of average percent CPU usage between Quincy (blue) and Reef (red) in a new cluster with generic object sizes. Reef’s RGW CPU usage showed a slight improvement compared to Quincy’s.
Conclusion 
Overall, upgrading to Reef means significant throughput improvements in most cases, especially for small object workloads. Although throughput may decrease during OSD failure scenarios, recovery time is much quicker in Reef compared to Quincy, particularly for small object workloads.
As more and more users upgrade to Reef, we welcome any and all performance feedback from the community. Make your voice heard on the ceph-users mailing list, or join us in Slack!